What is it?
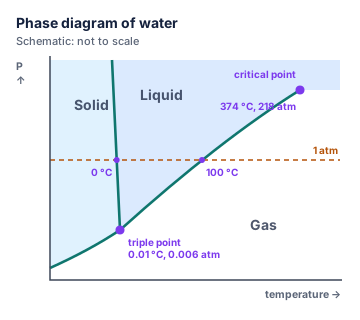
A phase diagram is a map that shows which state (phase) of a substance is stable at each combination of temperature (horizontal axis) and pressure (vertical axis).
- The three areas are the regions where the substance is solid, liquid or gas.
- The lines between them show the conditions where two phases exist together in equilibrium. Crossing a line means a phase change: the solid–liquid line gives the melting point at each pressure, the liquid–gas line the boiling point, and the solid–gas line the sublimation point.
- At the triple point, all three phases coexist.
- The liquid–gas line ends at the critical point. Above it, liquid and gas can no longer be told apart: the substance is a supercritical fluid.
Key idea
To read a phase diagram, find the point for the given temperature and pressure and see which region it lies in. The normal melting and boiling points are where the horizontal line at 1 atm crosses the solid–liquid and liquid–gas lines.
Why does it matter?
- Dry ice. Solid CO₂ turns straight into gas at room pressure, with no liquid: the phase diagram explains why.
- Freeze-drying and decaffeination. Freeze-drying works below water’s triple point, where ice sublimes. Supercritical CO₂ is used to remove caffeine from coffee.
- Weather and planets. Phase diagrams explain why liquid water cannot exist on the surface of Mars, where the pressure is below water’s triple point.
How does it work?
1. Reading the diagram
For a point at a given temperature and pressure:
- left (low temperature) and high pressure: solid;
- middle: liquid;
- right (high temperature) and low pressure: gas.
Moving horizontally (changing temperature at constant pressure) traces a heating or cooling curve. Moving vertically (changing pressure at constant temperature) shows what compression or expansion does.
2. Water: an unusual slope
For almost every substance the solid–liquid line slopes to the right (more pressure raises the melting point), because the solid is denser than the liquid. Water’s line slopes to the left: ice is less dense than liquid water, so squeezing ice favours the liquid and lowers the melting point slightly.
| Water | Carbon dioxide | |
|---|---|---|
| Triple point | 0.01 °C, 0.00604 atm | −56.6 °C, 5.11 atm |
| Critical point | 374 °C, 218 atm | 31.0 °C, 72.8 atm |
| At 1 atm | melts at 0 °C, boils at 100 °C | sublimes at −78.5 °C |
| Solid–liquid line | slopes left | slopes right |
3. Carbon dioxide: no liquid at 1 atm
The triple-point pressure of CO₂ (5.11 atm) is above 1 atm. At atmospheric pressure the horizontal line misses the liquid region completely, so solid CO₂ goes straight to gas. Liquid CO₂ only exists above 5.11 atm, for example inside a fire extinguisher.
Think of it like this
A phase diagram is like a map with three countries: Solid, Liquid and Gas. The borders are the lines, where two countries meet. The triple point is the one spot where all three borders meet. The critical point is where the border between Liquid and Gas simply fades away.
More precisely
The slope of each line is given by the Clapeyron equation: it depends on the enthalpy and the volume change of the transition. Because ice has a larger volume than liquid water, the volume change on melting is negative and the slope is negative. The liquid–gas line is the vapour-pressure curve: each point gives the vapour pressure of the liquid at that temperature. Real phase diagrams of water are much more complicated at very high pressures, with many different forms of ice.
Visualise it
Worked example
Worked example: Reading the CO₂ data
Question: In which state is carbon dioxide at (a) 1 atm and 25 °C (b) 60 atm and 0 °C (c) 100 atm and 40 °C?
- (a) Above its sublimation point at 1 atm (−78.5 °C): gas.
- (b) Above the triple-point pressure, and 60 atm is above the vapour pressure of liquid CO₂ at 0 °C (about 34 atm): liquid.
- (c) Above both 31.0 °C and 72.8 atm, the critical point: supercritical fluid.
Worked example: Why dry ice sublimes
Question: Explain why solid CO₂ at 1 atm turns directly into gas, while ice melts.
At 1 atm, CO₂ is below its triple-point pressure (5.11 atm), so the 1 atm line passes from the solid region straight into the gas region: sublimation. For water, 1 atm is far above the triple-point pressure (0.00604 atm), so the 1 atm line crosses the liquid region: ice melts, then boils.
Worked example: Converting triple-point pressures
Question: Express the triple-point pressures of water (611.7 Pa) and CO₂ (5.11 atm) in kPa.
-
Water:
-
CO₂:
-
CO₂’s triple point is about 850 times higher in pressure than water’s.
Worked example: Pressure and ice
Question: Ice at −1 °C is squeezed very hard. Using water’s phase diagram, what could happen?
Because water’s solid–liquid line slopes to the left, a vertical move upwards (higher pressure) from a point just left of the line can cross into the liquid region. Enough pressure can melt ice slightly below 0 °C.
Common mistake
Common mistake: Swapping the axes
Phase diagrams almost always have temperature on the x-axis and pressure on the y-axis. Read the axis labels before deciding which way “higher” is.
Common mistake: Thinking the triple point is a normal melting point
The triple point is at one specific pressure (0.00604 atm for water), not at 1 atm. The normal melting point (0 °C) and the triple point (0.01 °C) are close for water, but they are different points.
Common mistake: Assuming every substance has a liquid at 1 atm
CO₂ has no liquid at 1 atm, because its triple point lies above 1 atm.
Notation note
- “Normal” melting and boiling points are measured at exactly 1 atm.
- The pressure axis is often drawn on a stretched or logarithmic scale, so diagrams are usually not to scale.
Remember this
Remember this
- Axes: temperature (x) and pressure (y); areas = single phases; lines = two phases in equilibrium.
- Triple point: all three phases coexist. Critical point: end of the liquid–gas line; beyond it, a supercritical fluid.
- Normal melting and boiling points lie on the 1 atm line.
- Water’s solid–liquid line slopes left because ice is less dense than liquid water.
- CO₂ sublimes at 1 atm because its triple-point pressure (5.11 atm) is above 1 atm.
Test yourself
Check your understanding before moving on.
Flashcards
Phase Diagrams: Flashcards
- QuestionWhat does a phase diagram show?Answer
Which phase of a substance is stable at each temperature (x-axis) and pressure (y-axis).
- QuestionWhat do the lines on a phase diagram represent?Answer
Conditions where two phases coexist in equilibrium (melting, boiling or sublimation points).
- QuestionWhat is the triple point?Answer
The single temperature and pressure at which solid, liquid and gas coexist.
- QuestionWhat is the critical point?Answer
The end of the liquid–gas line; beyond it the substance is a supercritical fluid.
- QuestionWhere are the normal melting and boiling points on a phase diagram?Answer
Where the 1 atm line crosses the solid–liquid and liquid–gas lines.
- QuestionWhy does water's solid–liquid line slope to the left?Answer
Ice is less dense than liquid water, so higher pressure favours the liquid and lowers the melting point.
- QuestionGive the triple point of water.Answer
0.01 °C and 0.00604 atm (611.7 Pa).
- QuestionGive the triple point of CO₂.Answer
−56.6 °C and 5.11 atm.
- QuestionWhy does dry ice sublime at 1 atm?Answer
Its triple-point pressure (5.11 atm) is above 1 atm, so liquid CO₂ cannot exist at 1 atm.
- QuestionIn which state is CO₂ at 100 atm and 40 °C?Answer
Supercritical fluid (above 72.8 atm and 31.0 °C).
Tip: press Space to flip and ← → to move between cards.
Quiz
Phase Diagrams: Quiz
7 questions
The triple point is where the three lines meet: all three phases coexist.
Show answer
Answer: Solid, liquid and gas in equilibrium
The triple point is where the three lines meet: all three phases coexist.
Above the critical temperature and pressure, liquid and gas can no longer be distinguished: the substance is a supercritical fluid.
Show answer
Answer: A supercritical fluid
Above the critical temperature and pressure, liquid and gas can no longer be distinguished: the substance is a supercritical fluid.
At 1 atm water melts at 0 °C and boils at 100 °C, so at 50 °C it is liquid.
Show answer
Answer: Liquid
At 1 atm water melts at 0 °C and boils at 100 °C, so at 50 °C it is liquid.
Liquid CO₂ only exists above 5.11 atm. At 1 atm the solid region borders the gas region directly.
Show answer
Answer: Its triple-point pressure (5.11 atm) is above 1 atm
Liquid CO₂ only exists above 5.11 atm. At 1 atm the solid region borders the gas region directly.
Because ice is less dense than liquid water, squeezing ice favours the liquid, so the melting point falls slightly as pressure rises.
Show answer
Answer: Increasing pressure lowers the melting point
Because ice is less dense than liquid water, squeezing ice favours the liquid, so the melting point falls slightly as pressure rises.
The pressure is above the vapour pressure at 0 °C, and both T and P are below the critical point (31.0 °C, 72.8 atm), so CO₂ is liquid, as in a fire extinguisher.
Show answer
Answer: Liquid
The pressure is above the vapour pressure at 0 °C, and both T and P are below the critical point (31.0 °C, 72.8 atm), so CO₂ is liquid, as in a fire extinguisher.
Pressure is on the y-axis, so a vertical move upward is compression at constant temperature.
Show answer
Answer: increasing the pressure at constant temperature
Pressure is on the y-axis, so a vertical move upward is compression at constant temperature.
Notes and downloads
Worksheet
Phase Diagrams Worksheet
8 questions on reading the phase diagrams of water and carbon dioxide, triple and critical points, sublimation and unit conversions. Answer key included.
References
- Brown, T. L.; LeMay, H. E., Jr.; Bursten, B. E.; Murphy, C. J.; Woodward, P. M.; Stoltzfus, M. W. Chemistry: The Central Science, 15th ed.; Pearson, 2022.
Practise this topic with flashcards and a quiz at chemistryclarity.com/chemistry/phase-diagrams/
Spotted a mistake? Let us know and we'll fix it.