Worksheet
Phase Diagrams Worksheet
8 questions on reading the phase diagrams of water and carbon dioxide, triple and critical points, sublimation and unit conversions. Answer key included.
- Type
- Worksheet
- Level
- Intermediate
- Format
- PDF, ready to print
Preview the questions
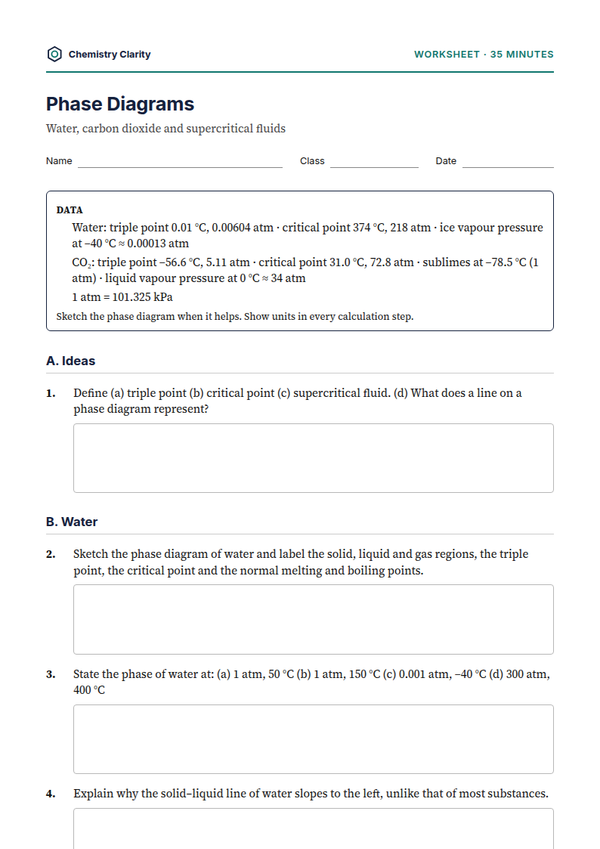
All the questions on this worksheet (about 35 minutes). Download the PDF to print it with space for working; the free answer key has full worked solutions.
A. Ideas
1.
Define (a) triple point (b) critical point (c) supercritical fluid. (d) What does a line on a phase diagram represent?
B. Water
2.
Sketch the phase diagram of water and label the solid, liquid and gas regions, the triple point, the critical point and the normal melting and boiling points.
3.
State the phase of water at: (a) 1 atm, 50 °C (b) 1 atm, 150 °C (c) 0.001 atm, −40 °C (d) 300 atm, 400 °C
4.
Explain why the solid–liquid line of water slopes to the left, unlike that of most substances.
C. Carbon dioxide
5.
State the phase of CO₂ at: (a) 1 atm, −100 °C (b) 1 atm, −50 °C (c) 60 atm, 0 °C (d) 80 atm, 50 °C
6.
Describe what happens, in order, when solid CO₂ is warmed from −100 °C to 25 °C (a) at 1 atm (b) at 10 atm.
D. Calculations and applications
7.
Convert to kPa: (a) the critical pressure of CO₂ (b) the critical pressure of water, also in MPa.
8.
Freeze-dried coffee is made by freezing coffee and then lowering the pressure below 0.006 atm. Use the phase diagram of water to explain how the water is removed without melting.