What is it?
A coloured solution looks coloured because it absorbs some wavelengths of light and lets the rest through. The more concentrated the solution, the more light it absorbs. Spectrophotometry measures this absorption to find the concentration of a substance, quickly and with very small samples.
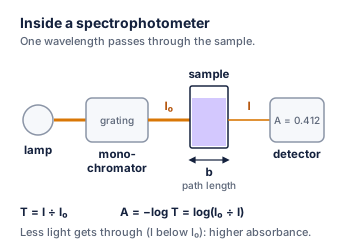
A spectrophotometer shines light of one chosen wavelength through the sample and measures how much comes out:
- is the intensity of light entering the sample, and the intensity leaving it.
- Transmittance: (between 0 and 1), or as a percentage, .
- Absorbance:
Absorbance and transmittance are ratios, so they have no units. A = 0 means no light is absorbed; A = 1 means only 10 % gets through; A = 2, only 1 %.
Key idea
Beer’s law (the Beer–Lambert law): absorbance is directly proportional to concentration.
where is the molar absorptivity (L mol⁻¹ cm⁻¹, a constant for that substance at that wavelength), is the path length of the cell (cm, usually 1.00 cm) and is the concentration (mol/L). Double the concentration, double the absorbance.
Why does it matter?
- Medicine. Blood tests for glucose, cholesterol and haemoglobin use colour reactions read by a spectrophotometer.
- Environment. Nitrate, phosphate and iron in drinking water and rivers are measured this way.
- Biology and industry. DNA and protein concentrations, food colourings and the progress of reactions are all followed by absorbance.
How does it work?
1. The spectrophotometer
Light from a lamp passes through a monochromator (a grating), which selects one wavelength. That light passes through the sample in a cuvette of path length and reaches a detector, which reports or . The wavelength chosen is usually the one at which the substance absorbs most strongly, : there the measurement is most sensitive, and small errors in the wavelength setting matter least.
2. Checking the units in Beer’s law
All the units cancel, so has no unit, as it should.
3. The calibration curve
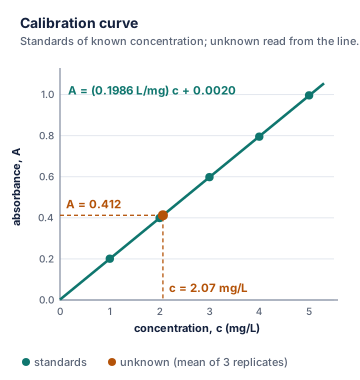
In practice, is rarely taken from a table. Instead:
- Zero the instrument with a blank: the solvent and reagents, without the substance being measured. This removes absorption by everything else.
- Measure a series of standards of known concentration.
- Plot absorbance against concentration and draw the best-fit straight line (by least squares, using a calculator or spreadsheet).
- Measure the unknown in replicate (at least in triplicate), find the mean absorbance and its standard deviation, and read the concentration from the line.
The unknown should lie within the range of the standards. If its absorbance is too high, dilute it by a known factor and measure again.
Think of it like this
Think of sunglasses. One pair of lenses dims the light by a certain fraction; two pairs stacked dim it again by the same fraction. A thicker or darker filter (a longer path length or a higher concentration) lets through less light. Absorbance is the scale that turns this “fraction of a fraction” behaviour into a simple straight line.
More precisely
Beer’s law holds best for dilute solutions and absorbances up to about 1. At high concentrations, molecules interact with one another, and at very high absorbances so little light reaches the detector that stray light causes errors; the calibration line then curves. Beer’s law also assumes monochromatic light, which is why the monochromator matters. The slope of the calibration line is the sensitivity, and the intercept should be close to zero if the blank was correct.
Visualise it
Worked example
Worked example: From transmittance to absorbance
Question: A solution transmits 25.0 % of the light. What is its absorbance?
- 0.602 (no unit)
Worked example: Using Beer's law
Question: A dye has L mol⁻¹ cm⁻¹ at its . A solution of the dye in a 1.00 cm cell has an absorbance of 0.540. Find its concentration.
-
Rearrange:
-
Substitute:
-
The cm cancels, and : 4.50 × 10⁻⁵ mol/L.
Worked example: An unknown from a calibration curve, measured in triplicate
Question: Standards of an iron complex (1.00 to 5.00 mg/L) give the best-fit line . A water sample is measured three times: A = 0.412, 0.416 and 0.409. Find the iron concentration, and comment on the precision.
- Mean absorbance:
- Standard deviation (sample, ): ; relative standard deviation
- Rearrange the line:
- Substitute: 2.07 mg/L
- Report: (). An RSD below 1 % shows good precision; the result lies inside the range of the standards (1.00 to 5.00 mg/L), so the reading is reliable.
Common mistake
Common mistake: Using %T directly in the absorbance formula
Convert a percentage to a fraction first: for 25.0 %T, , not . An absorbance is never negative for a real sample.
Common mistake: Thinking transmittance is proportional to concentration
Only absorbance is proportional to concentration. Doubling the concentration doubles A, but squares T (for example, T = 0.50 becomes T = 0.25).
Common mistake: Reading far outside the calibration range
A result outside the standards relies on the line continuing straight, which may not be true at high absorbance. Dilute the sample by a known factor (and multiply the result by it), or add more standards.
Notation note
- Molar absorptivity is also called the molar extinction coefficient; its units can be written L mol⁻¹ cm⁻¹ or M⁻¹ cm⁻¹.
- Some books write with the absorptivity in mass units (for example L g⁻¹ cm⁻¹), when is in g/L.
- The blank is sometimes called the reference solution.
Remember this
Remember this
- ; . Both have no units.
- Beer’s law: , with in L mol⁻¹ cm⁻¹, in cm, in mol/L.
- Measure at , zero with a blank, and use a calibration curve of standards.
- Measure unknowns in replicate (at least triplicate) and report the mean ± standard deviation; stay inside the calibration range.
Test yourself
Check your understanding before moving on.
Flashcards
Spectrophotometry and Beer's Law: Flashcards
- QuestionDefine transmittance.Answer
T = I ÷ I₀, the fraction of light that passes through the sample (no unit). %T = T × 100 %.
- QuestionHow is absorbance related to transmittance?Answer
A = −log T = log(I₀ ÷ I). It has no unit.
- QuestionState Beer's law.Answer
A = εbc: absorbance is proportional to concentration (ε in L mol⁻¹ cm⁻¹, b in cm, c in mol/L).
- QuestionWhat is ε?Answer
The molar absorptivity: a constant for a substance at a given wavelength, in L mol⁻¹ cm⁻¹.
- QuestionWhy measure at λmax?Answer
Absorption is strongest there, so the method is most sensitive, and small wavelength errors matter least.
- QuestionWhat is a blank, and why is it used?Answer
The solvent and reagents without the analyte. It zeroes the instrument so only the analyte absorption is measured.
- QuestionWhat is a calibration curve?Answer
A plot of absorbance against concentration for standards of known concentration; the unknown is read from its best-fit line.
- QuestionWhy measure the unknown in replicate?Answer
To assess precision: report the mean ± standard deviation (at least triplicate) instead of a single reading.
- QuestionWhat is the absorbance when 10 % of the light is transmitted?Answer
A = −log(0.100) = 1.000.
- QuestionWhen does Beer's law break down?Answer
At high concentrations or high absorbances (above about 1), and with non-monochromatic light: the calibration line curves.
Tip: press Space to flip and ← → to move between cards.
Quiz
Spectrophotometry and Beer's Law: Quiz
7 questions
T = 0.500, so A = −log(0.500) = 0.301. Using 50.0 instead of 0.500 gives −1.70, which is impossible for a real sample.
Show answer
Answer: 0.301
T = 0.500, so A = −log(0.500) = 0.301. Using 50.0 instead of 0.500 gives −1.70, which is impossible for a real sample.
Beer's law, A = εbc: A is directly proportional to c.
Show answer
Answer: doubles
Beer's law, A = εbc: A is directly proportional to c.
A has no unit, so ε = A ÷ (b × c) has units 1 ÷ (cm × mol/L) = L mol⁻¹ cm⁻¹.
Show answer
Answer: L mol⁻¹ cm⁻¹
A has no unit, so ε = A ÷ (b × c) has units 1 ÷ (cm × mol/L) = L mol⁻¹ cm⁻¹.
c = A ÷ (εb) = 0.450 ÷ (1.50 × 10⁴ L mol⁻¹ cm⁻¹ × 1.00 cm) = 3.00 × 10⁻⁵ mol/L.
Show answer
Answer: 3.00 × 10⁻⁵ mol/L
c = A ÷ (εb) = 0.450 ÷ (1.50 × 10⁴ L mol⁻¹ cm⁻¹ × 1.00 cm) = 3.00 × 10⁻⁵ mol/L.
The blank contains everything except the analyte, so absorption by the solvent, reagents and cell is subtracted.
Show answer
Answer: to zero the instrument so that only the analyte absorbance is measured
The blank contains everything except the analyte, so absorption by the solvent, reagents and cell is subtracted.
A is proportional to the path length b: doubling b doubles A.
Show answer
Answer: 0.500
A is proportional to the path length b: doubling b doubles A.
The reading must fall inside the calibration range; Beer's law may not hold at high absorbance. A longer cell would raise A even further.
Show answer
Answer: dilute the unknown by a known factor, measure again and multiply by the factor
The reading must fall inside the calibration range; Beer's law may not hold at high absorbance. A longer cell would raise A even further.
Notes and downloads
Worksheet
Spectrophotometry and Beer's Law Worksheet
9 questions on transmittance and absorbance, Beer's law, dilution, calibration curves with replicates, and a copper analysis. Answer key included.
References
- Brown, T. L.; LeMay, H. E., Jr.; Bursten, B. E.; Murphy, C. J.; Woodward, P. M.; Stoltzfus, M. W. Chemistry: The Central Science, 15th ed.; Pearson, 2022.
Practise this topic with flashcards and a quiz at chemistryclarity.com/chemistry/beer-lambert-law/
Spotted a mistake? Let us know and we'll fix it.